Submerged Aquatic Vegetation - Alabama’s Seagrass Beds
Submerged aquatic vegetation (SAV or seagrass beds) are rooted, vascular plants that occur in shallow water across a broad range of salinity preferences. They are highly valuable in estuarine ecosystems due to the numerous ecological functions they perform:
- Commercially and recreationally important fish and shellfish are dependent upon SAV for all or part of their life histories, particularly as nursery habitat for juvenile fishes.
- Animals in seagrass beds are ten to 100 times more abundant than over adjacent sandy bottoms, and an acre of SAV supports up to 40,000 fish and one thousand times that many small invertebrates. “Epiphytes,” like filter-feeding sponges, bryozoans, or tunicates, attach to sea grasses and remove suspended particles and algae that compete with the SAV for light and provide food for small and juvenile fish. (http://www.sms.si.edu/irlspec/Seagrass_habitat.htm).
- Seagrasses provide food for some fish, mollusks, crustaceans, manatees, and waterfowl.
- SAV improves water quality by trapping loose sediment in their roots and absorbing stormwater-delivered pollutants, like excess nutrients.
The extent of SAV in Alabama’s waters was greatly reduced during the twentieth century, due in part to land use conversion, associated degradation of water quality by stormwater-derived sediments and nutrients, and scarring from recreational boat propellers. With SAV data in coastal Alabama inadequate to assess the status of this resource, mapping was necessary to establish a baseline to track future trends. The MBNEP partnered with Alabama Department of Conservation and Natural Resources, State Lands Division to perform a 2002 baseline analysis of SAV distribution and then an analysis of mid-twentieth century imagery for comparison to 2002 data. They repeated efforts to map SAV distribution in 2008-2009 and again in 2015 to analyze trends. The Gulf Coast Ecosystem and Restoration Council and RESTORE Act will fund a Submerged Aquatic Vegetation Pilot Project in Mobile Bay to assist and inform development of an SAV monitoring, assessment, and reporting standards and protocols for multiple scales Gulf-wide.
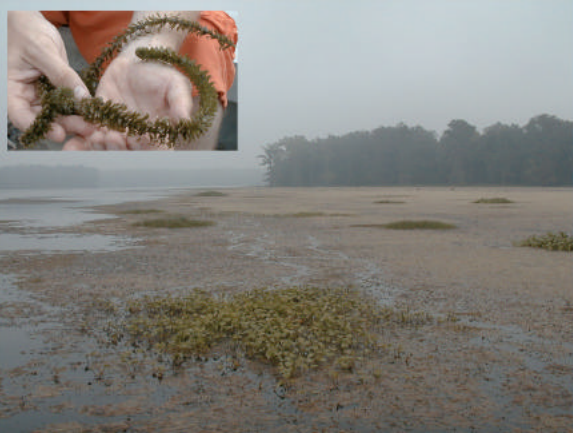
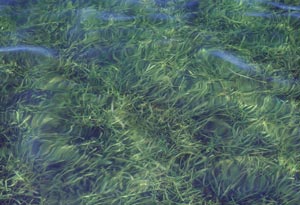
SAV in McReynolds Lake, 2002. Inset: Hydrilla verticillata
2002 SAV Mapping. In 2002, with a Comprehensive Conservation and Management Plan (CCMP) goal of identifying the current status of SAV resources in coastal Alabama, the MBNEP undertook an initial geographical information system (GIS) mapping effort using aerial photography to provide detailed information on the distribution of SAV species in Alabama’s estuarine waters. The project area encompassed the entire coastal of Alabama from the Florida to Mississippi border, north to Louisville and Nashville Railroad north of Mobile Bay. Digital orthophotographs were created from true color aerial photography and analyzed using ArcView GIS. (MBNEP SA Vrpt). Significant results included:
- A total of 6,713.9 acres of SAV was mapped, with 84% continuous (>50%) coverage, 11.5% patchy (10-50%) coverage, and 4.3% scattered (<10%) coverage.
- The most abundant SAV species identified in this study included:
Shoal grass (Halodule wrightii), a native marine and brackish water species.
Eel grass, tape grass, or wild celery (Vallisneria neotropicalis), a native freshwater species.
Eurasian watermilfoil (Myriophyllum spicatum) an invasive exotic freshwater species.
Southern naiad (Najas guadupensis), a native freshwater species.
Widgeon grass (Ruppia maritima), a native, salt-tolerant freshwater species.
Coon’s tail (Ceratophyllum demersum), a native freshwater species.
Water stargrass (Heteranthera dubia) - Most of the total SAV acreage in the project area was located in the lower Delta.
- Investigators warned that general use of 2002 SAV survey data for management and permitting decisions could be problematic, due to the often-ephemeral (or transient) nature of SAV species distribution and abundance
2005 Historical SAV Distribution Study. To provide information on the historic distribution of SAV in coastal Alabama, photo-documented portions of Mobile County (1940) and Baldwin County (1955 and 1966) were digitized and georeferenced for GIS analysis and comparison to 2002 maps (NEP historic SAV). The results of this investigation support reports of more widespread distribution of SAV in coastal Alabama during the mid-twentieth century than in 2002. Along the western shore of Mobile Bay and in Mississippi Sound, only 45% of 1940 acreage remained. Along Mobile Bay’s eastern shore, Wolf Bay, Bay la Launch, Arnica Bay, and Perdido Bay, only 11.7% of 1955 acreage remained. Along the eastern shore, north of Point Clear, only 71% of 1966 acreage remained.
The study also attempted to develop a priority list of potential SAV restoration sites in our coastal waters. Although changes in SAV distribution can reflect responses to natural coastal cycles and climate, the prominent decline and persistent disappearance in acreage since the mid-twentieth century indicate that human activity has altered habitats capable of supporting SAV. The decline is blamed on dredging and filling activities, shoreline development, vessel traffic, and water quality deterioration. The study recommended locations once supporting SAV that have not significantly altered or developed, without high vessel traffic, or with poor water quality.
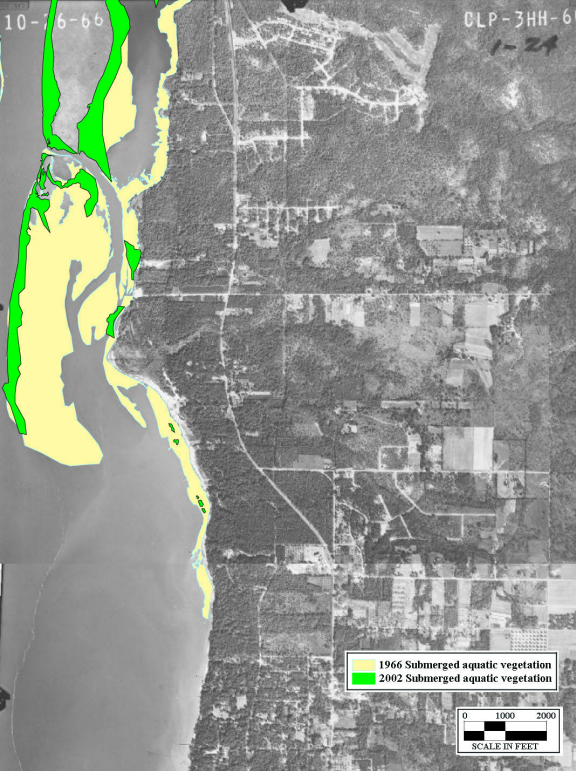
Extent of SAV in 1966 (yellow) compared to 2002 (green) on the northeastern shore of Mobile Bay, in Baldwin County.
2008-2009 SAV Mapping. In 2008, the MBNEP and State undertook another GIS mapping effort providing detailed information on the distributions of SAV in coastal Alabama for comparison to the 2002 baseline survey (SA Vfinal Jan2010). With a late start in 2008, two seasonal surveys were performed based on aerial imagery acquired obtained October 1, 2008 and July 20 and August 26, 2009. Outlines of SAV “signatures” in the ortho imagery were digitized in a GIS environment then field-verified to document habitat characteristics at the surface level.
A total of 5704 acres of SAV was mapped in 2008 and 2009; again most of the acreage was mapped in the lower Delta. Fifty-seven percent of the total SAV acreage (2,981.6 acres) was mapped as continuous (>50%) coverage. Overall, 1,371.3 fewer acres were mapped in 2009 than in the 2002 survey, primarily due to substantially less SAV in the Delta and Mobile Bay in 2009. Several areas of the Mobile -Tensaw Delta that supported large SAV beds in 2002 were devoid of SAV in 2008 and 2009. Dynamics of SAV occurrence in the Delta are poorly known, and reasons for the decline are not clear. As in 2002, most habitats mapped in 2009 contained mixtures of species found in northern Mobile Bay and the Delta. Invasive Eurasian watermilfoil and wild celery were the most prevalent species.
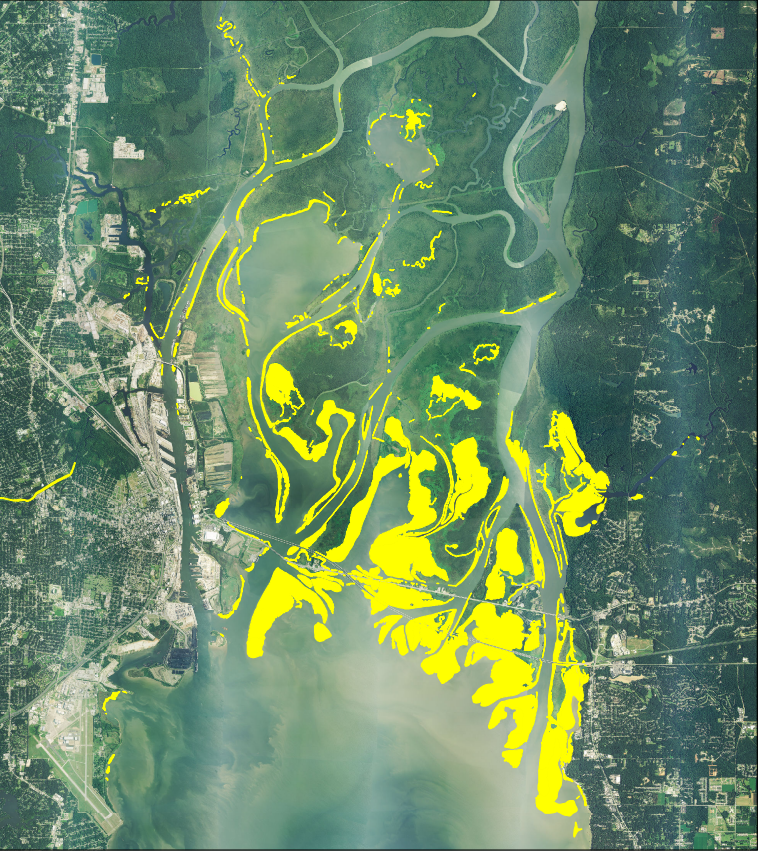
2015 Submerged Aquatic Vegetation (yellow) in the lower Mobile Tensaw Delta.
2015 SAV Mapping. Consistent with the State’s and MBNEP’s strategy to track SAV trends, another mapping project was undertaken to provide data on the distribution of SAV species in Alabama waters based upon aerial imagery obtained during summer (July and August) and fall (October) 2015 (SAV 2016). Overall, 9,234.3 acres of SAV were mapped in 2015 – 3875 more acres than in 2008-09 and 2,534.6 more than in 2002. Again, the majority of the total mapped was located in the lower Delta, with an increase of 2,966 acres there. The most frequently encountered species were wild celery, Eurasian watermilfoil, southern naiad, widgeon grass, water stargrass, shoal grass, and coon’s tail.
The loss of SAV extent documented in the lower Mobile-Tensaw Delta between 2002 and 2009 had largely recovered by 2015, an exception being the northernmost portion of the study area. In addition to increased SAV extent in the Delta compared to 2009, substantial SAV was present in 2015 at several locations that did not support it in 2002 or 2009. The Dog River Watershed, in particular, contained large areas of SAV, with pondweed mixtures in Halls Mill Creek, Rattlesnake Bayou, and Rabbit Creek grading into wild celery, Eurasian watermilfoil, and widgeon grass in Dog River proper. Other areas in Mobile County with mapped SAV in 2015 but not in the 2009 or 2002 surveys included Duck Lake, Heron Bayou, Three Mile Creek, and East Fowl River. In Baldwin County, SAV was mapped in Nolte Creek (Magnolia River), Shelby Lake, and Bon Secour Bay, none of which contained mapped SAV in 2009 or 2002.
Submerged Aquatic Vegetation Pilot Project in Mobile Bay. This project, led by Dr. Ken Heck’s Dauphin Island Sea Lab laboratory, will build upon and continue past Tier 1 efforts (characterization of the overall distribution and extent of seagrasses in a defined ecosystem) by advancing to Tier 2 and 3 monitoring. Tier 2 efforts will be undertaken to characterize the ecological condition of seagrasses over relatively large areas by selecting a greater number of statistically valid sample sites and monitoring at higher temporal frequencies. Tier 2 data provides more detailed attributes describing the spatial-temporal variation in seagrass structure (e.g., species composition, size) and abundance (e.g., percent cover, shoot density) to quantify stressor/response relationships and produce estimates of the ecological condition of resources over broad areas. Tier 3 monitoring includes more intensive monitoring than Tier 2, sometimes using a larger number of metrics sampled simultaneously and more frequently, and usually at a smaller number of sites that are smaller in size. Tier 3 monitoring is driven by specific scientific hypotheses (e.g., measuring levels of uncertainty, evaluating multiple process-related responses) and local and regional programs that directly address questions regarding the specific mechanisms responsible for the changes detected in Tiers 1 and 2. Tier 3 can be effectively used to monitor the suspected drivers of change simultaneously with multiple seagrass stress response metrics to gain much better resolution and decrease ambiguity. Tier 3 monitoring is designed to test hypotheses and confirm or refute suspected mechanisms for stressor/response relationships.


